What does success in your business mean to you? Can you track it? If you were to track it, what performance metrics would you say are most important?
These are some of the questions you need to start asking yourself if you want to achieve scalable growth.
What is a Business Performance Metric?
Business performance metrics, also known as KPIs (key performance indicators), are quantifiable measures used to evaluate the success of a business.
Your business is more complex than a single performance metric can reveal. And every business is different—some performance metrics that work for you may not apply to another company, and vice versa.
By setting SMART business goals and associating specific performance metrics with each goal you consistently monitor, you can paint the bigger picture of your success.
Which Business Performance Metrics Should You Track?
When tracking business performance metrics, less is more. Even if you track many metrics, focus on the top 5-7 that make the most sense for your business goals and monitor them each week.
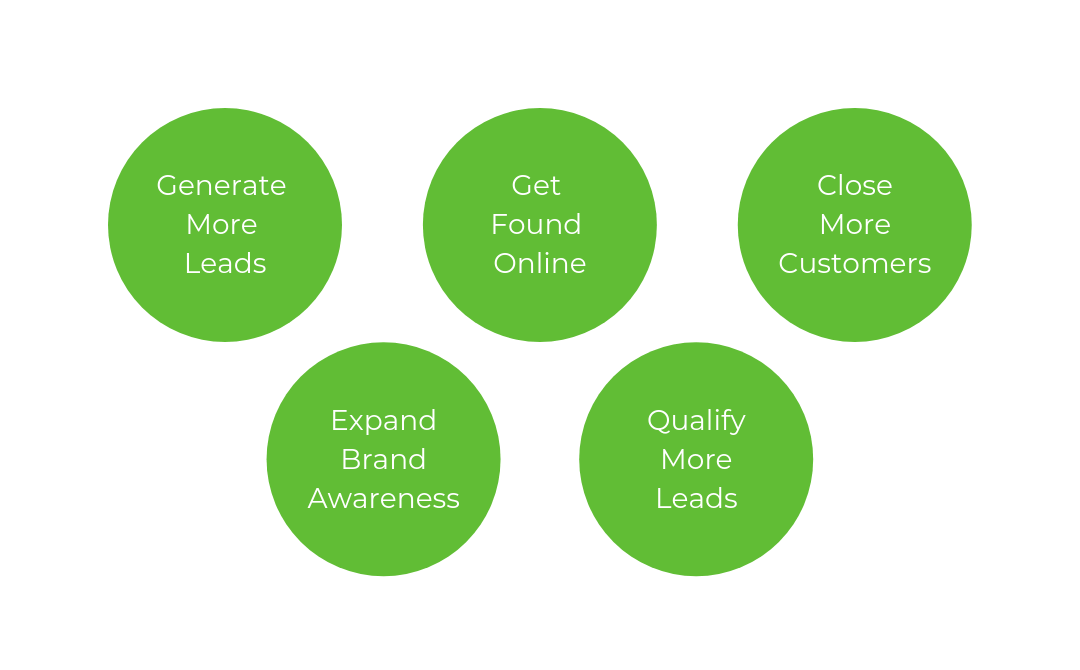
Do you want to escalate your brand awareness? Are you getting many leads but need to better qualify (or disqualify) them for the sales team?
Don’t waste time analyzing too many numbers that don’t affect the target goals you land on—whatever they may be.
You can choose from hundreds of performance metrics to track your business’s growth. So, choose wisely.
To be effective, your business performance metrics must be:
- Clear and visible throughout your organization
- Quantifiable and monitored frequently
- Necessary to achieve your business goal
Examples of Business Performance Metrics by Business Category
Sales
- Revenue vs. budget
- New customers
- Time to acquire
- Renewal rate
- Market share
- Upsold customers
- Net promoter score
- Customer lifetime value
Marketing
- Cost per lead
- Qualified leads
- Qualified prospects
- Click-through rate
- Competitive rank
- Conversion rate
- Marketing ROI
- New followers
- Web traffic
Operations
- Time to install
- Time to resolve
- Overtime hours
- Employee retention
- Employee productivity
- Customer support tickets
- Plant/equipment productivity
Development
- Bug resolution
- Team productivity
- Status against deadline
- Status against budget
- Recruiting efficiency
Finance
- Net profit
- Debt-asset ratio
- Gross profit margin
- Day sales outstanding
- Costs of goods sold
Business Performance Metrics for Digital Marketing
Like any other facet of your business, you can use dozens of metrics to measure your website’s success. We need to narrow those down into the top performance metrics you can use to determine the success of your digital marketing efforts. Here are our suggestions for metrics you should consider tracking:
Website Performance
Statistics show that a user will leave a web page if it takes more than three seconds to load. According to KISSmetrics, just a ONE-second delay in page load time can result in a 7% drop in conversions! Not only does this affect your visitors’ experience, but it can also negatively impact your search engine ranking.
Several factors can influence your website’s loading time, including messy code, large images and HTML files, Javascript, and more.
HubSpot’s Website Grader is an great place to test your website’s strength. You can analyze your site or a competitor’s sites to discover its strengths and weaknesses in the following areas:
- Performance: This will show you your page size, requests and speed and suggest ways to improve those areas.
- Mobile: This will analyze your site’s mobile responsiveness and viewport.
- SEO: This section will explain how well your site is understood by search bots and shows you the strength of your page titles, meta descriptions, headings and sitemap.
- Security: Lastly, this will tell you if your site is secure through an SSL certificate.
After a general strength analysis, you can further strengthen your core and set your user experience up for success with these tips:
- Simplify: Combine files, like HTML, CSS and JavaScript, with simple minifiers via WordPress plugins. Run a compression audit to get images and other files as small as possible.
- Drop It Low: Keep your TTFB (Time to First Byte) below 200 ms for the best speed.
- Master Mobile: Avoid losing visitors due to slow mobile load time! It’s a good idea to keep your website mobile-first and loading quickly on mobile. Check your mobile load speed with Google’s helpful tool. Then optimize your user experience, SEO and readability for mobile, and create a mobile version of your site.
- Keep It Direct: Use a tool like Screaming Frog to find all the redirects on your website and remove unnecessary requests to narrow down the HTTP slowdowns.
- Be a Good Host: Review your hosting and ensure your provider isn’t slowing your website’s speed.
There are also several other great tools you can use to test different aspects of your website performance:
- Google Analytics: Page download time, page load time, server response time and more.
- HotJar: User behavior, clicks and functionality.
- Unbounce: A/B page testing, real-time data, dynamic text replacement and more.
- SEMrush: Backlinks, advertising research, keyword research, etc.
Traffic Trends
On Google Analytics, you can view the percentages of your visitors from different locations, including social, organic search, paid ads, direct visits, referrals, etc. You can use this data to your advantage by noting which sources you aren’t getting much traffic from and pumping more into those.
For example, if you notice your website isn’t getting traffic from social media, find the areas where your information is needed and be there instead. Always use high-quality images and ensure you respond to inquiries on social media that show visitors that your brand is human. Use keyword research to put out blogs with insightful and innovative industry information to help your website rank higher on Google results and grab the attention of searchers.
Conversion Rate
Your conversion rate is the number of website sessions divided by the number of website conversions. You need to understand the number of people coming to your website and the number of people that are turning into leads are opportunities.
Which action your conversion data represents can vary depending on your goals and objectives. A conversion could be scheduling a consultation, voting, registering, downloading, or any valuable transaction for your business to associate with a conversion.
The primary purpose of your website for the user is to discover a solution to a problem or need. The primary purpose of your website for you is to convert visitors into leads.
Heat mapping tools like Crazy Egg make it easy to monitor your conversion rate by allowing you to see how users navigate your site, where they’re scrolling, where they’re clicking, and, more importantly, where they’re not clicking. After analyzing the heat maps, you can make changes to encourage users to take the actions you want them to take based on what they’re already doing.
Session Time
Monitoring how long a user spends on a page can tell you two things: one, that the page is well-designed and encourages users to explore, and two, that the content is worth reading.
If people aren’t spending much time on a particular page, perhaps the content needs some edits, or the design needs to be tweaked. On the other hand, if people spend a few minutes or so on a page, you might want to optimize the page to increase conversions, add a more prominent CTA, more information, etc.
Pages per Session
Pages per session focus on how many pages the user visited while on your site. A high number indicates that users are encouraged to continue to explore your website, as it is interesting and informational.
You can delve even further with the behavior flow feature in Google Analytics. This tool lets you track who visits your site, which links they click and what paths they follow.
Bounce Rate
We’ve all walked into that store or restaurant and did not get the right vibe, turned around, and left. Bounce rates are no different; a user landed on your site, decided it wasn’t right for them, then left. Your bounce rate represents the quality visitor you’re attracting, who’s coming to your site and saying, “I’m in the wrong place,” or “I don’t want to be here anymore.”
There are two primary reasons why you might have an exceptionally high bounce rate:
- One: The quality of visitors arriving on your website is not a good fit for your brand. Meaning we need to attract the right type of visitor.
- Two: Your website isn’t designed in a way that connects with users, tells your story and guides them through a seamless series of pages.
That’s just a good user experience; people don’t want to leave when you have a great user experience.
But tracking your bounce rate is critical because it gives you a gauge of the type of people walking in the door and who’s leaving immediately. Once you understand this, you can change your language, design and marketing efforts to ensure that users who arrive on your website stay on your website.
Want to learn more? Check out Johnny’s top 5 website metrics that every business owner or executive should monitor every day:
How to Track and Apply Business Performance Metrics
After you’ve identified your key business performance metrics, the tracking begins. We suggest using a scorecard to record and review your metrics weekly and quarterly.
Download Now: Free KPI Scorecard Template
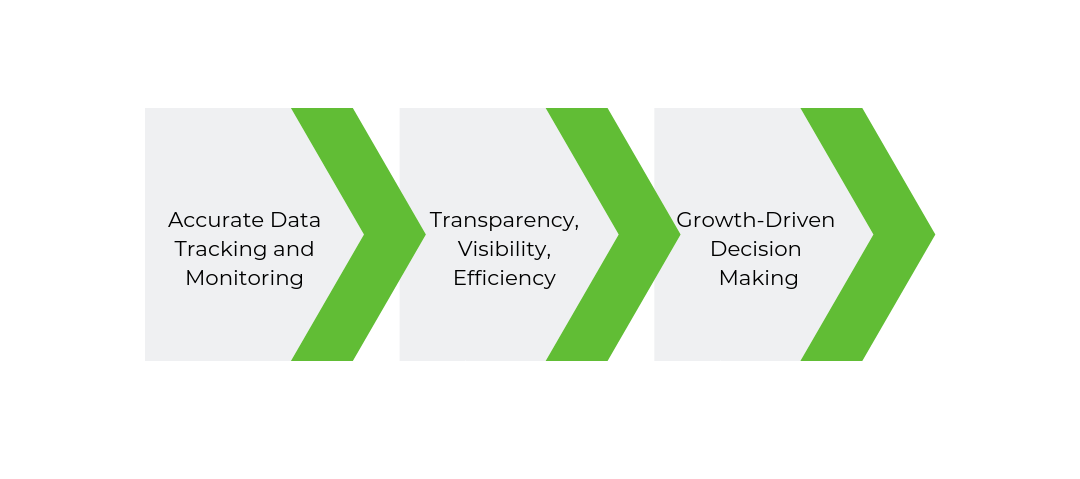
Some of the benefits of using a scorecard to track your business performance metrics include:
- More accurate data for decision making
- Speed and efficiency for business processes
- Transparency and visibility for all team members
Now that your metrics have a new place to live, it’s time to pack their bags and move them in!
Here are the next steps you should take:
- Identify who will track your business performance metrics and who is responsible for meeting the goal attached to it.
- Determine how each metric will be measured and if you need to set up an analytics software.
- Stay accountable for these metrics and their continued tracking, monitoring, and analysis. Don’t skip a single week!
After a few weeks, you should be able to start drawing some trends from your data. Remember: if you aren’t making data-driven decisions, you might as well not be tracking these performance metrics.
Don’t go with your gut, go with the numbers.
Don’t go with your gut, go with the numbers. It may take some getting used to, but trust us—if you’re doing it right, you’ll see positive changes in all departments.
Check out this quick exercise to help your team get on the same page about your business’s data and align themselves toward growth:
At Designzillas, we use business performance metrics to generate continuous growth for our clients and especially our own brand. Want to learn more about growing your business?